The heat pump that wasn't on anyone's list
.png)
€7’740 / year - These are the estimated annual cost of a heat pump running continuously in a school — connected to the school's electricity meter, serving a building under construction next door, invisible to every party responsible for the site.
The Challenge
Managing a portfolio of public school buildings means operating under a constraint that most energy managers recognise immediately: the data exists, but nobody has the bandwidth to read it systematically. Monthly billing figures arrive. The ESCO's dashboard confirms that heating systems in their perimeters are operating within contract parameters. The school administration has no complaints. Every signal, through every normal channel, says everything is fine.
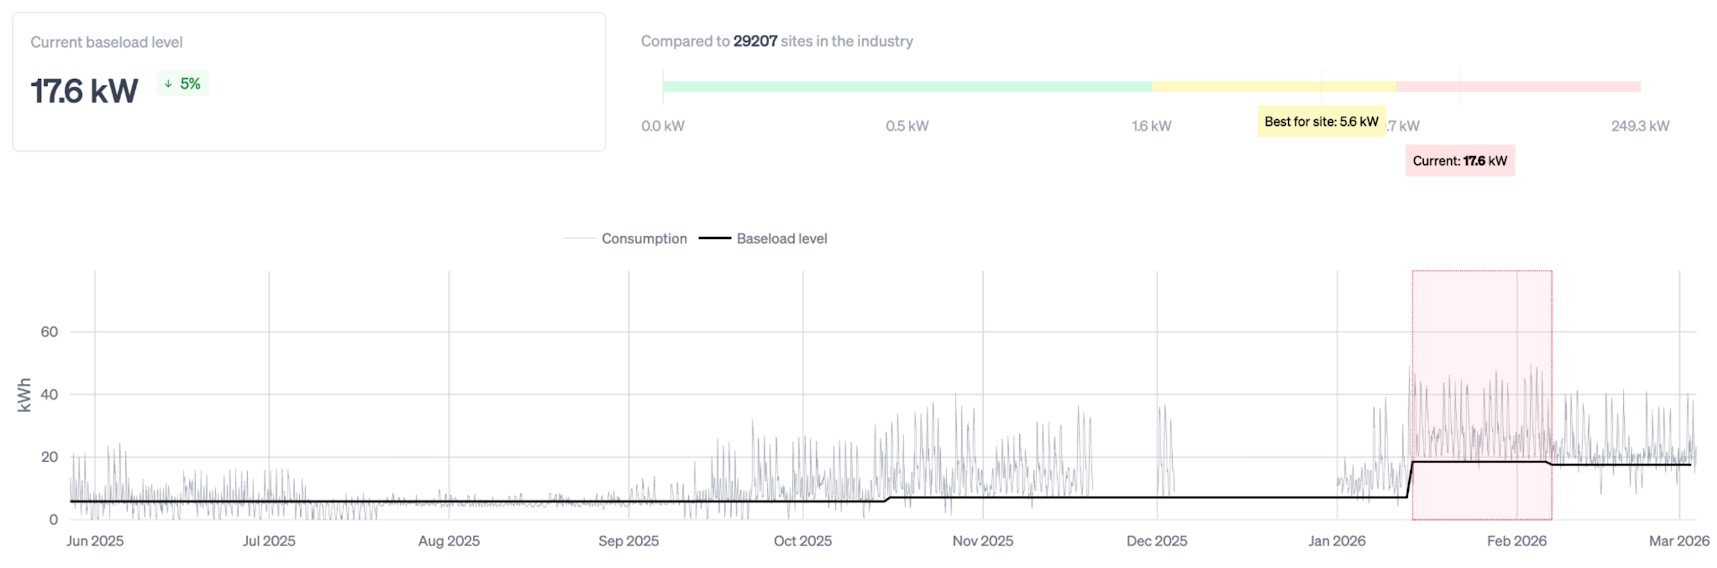
That was the situation at a secondary school in early 2026. The building had been connected to an existing smart electricity meter for several years. Its overnight baseload — the floor of consumption the building draws when classrooms are empty and corridors are dark — had been stable since at least 2021: approximately 7 kW, night after night, through weekends and school holidays alike. The thermal systems were managed under a service contract by the building's ESCO. Nothing in any report suggested a problem.
What the Data Showed
Ento connected to the school's existing smart electricity meter. No new hardware was installed, no sensors were added, no site visit was needed to establish the baseline. The platform reads hourly consumption data history (on the first day of connection , 18 months of previous history can already be retrieved) and compares it against each building's own rolling historical pattern and weather data.
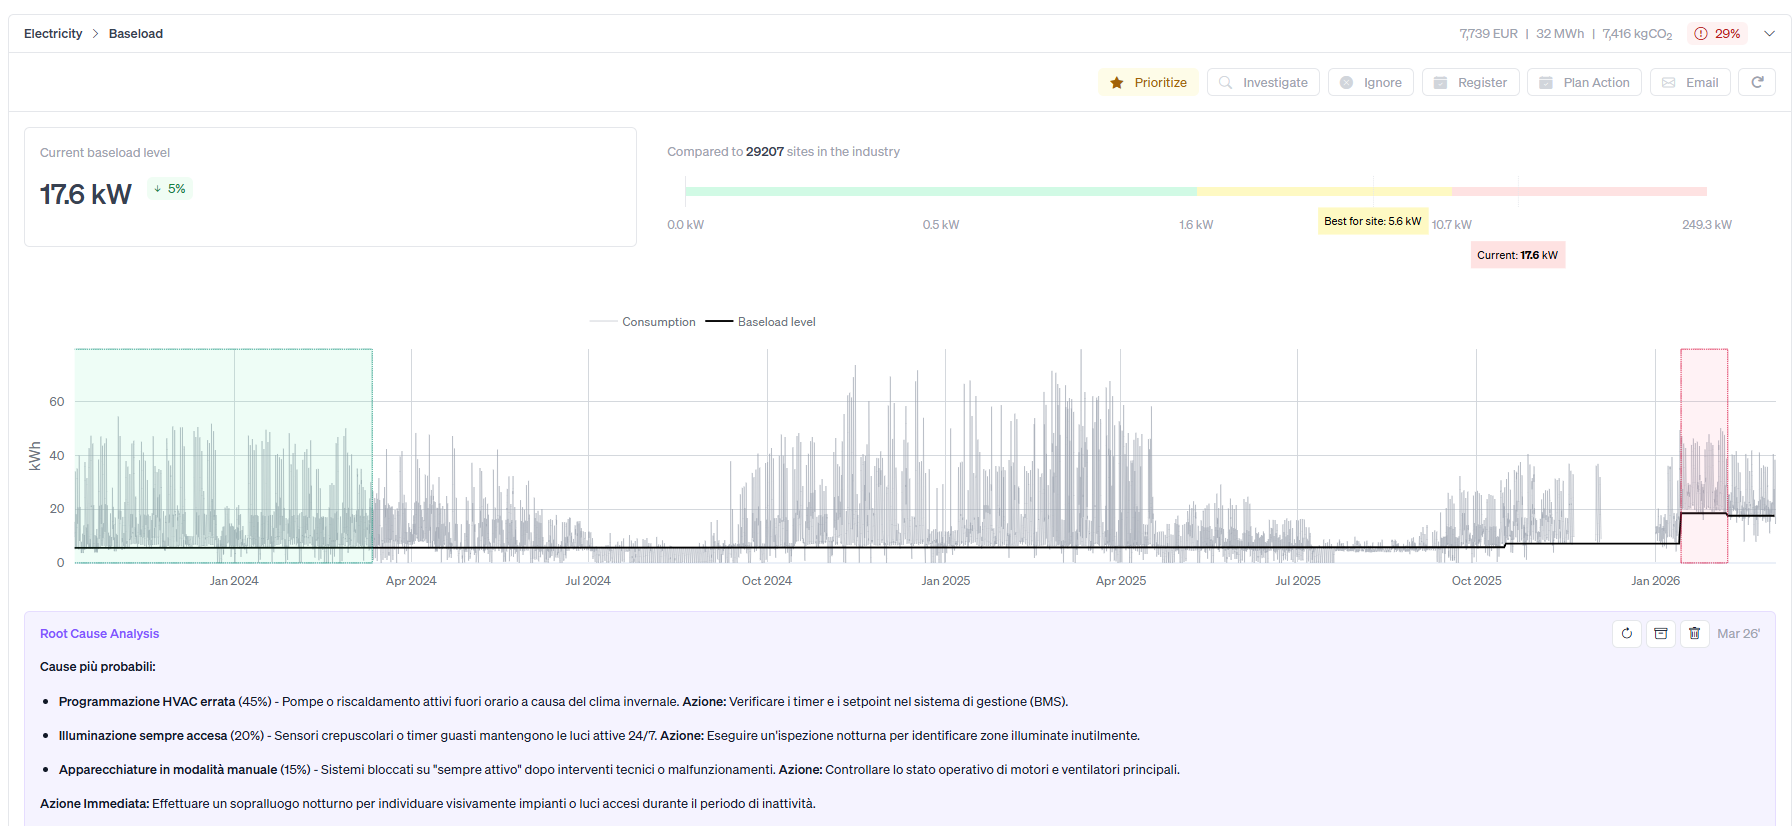
Ento's diagnostic output flagged the most probable cause as an HVAC system operating continuously, day and night.
That diagnosis was correct — but the platform had no way to know the equipment was not inside the school. Based on the meter data alone, the load appeared to belong to the building being monitored.
When the team added the contextual information: “There are no systems switched on at night in the historical building. A new building is under construction nearby. What could it be?” that the picture became complete. The platform's hypothesis and the field observation pointed to exactly the same thing.

The Human Reaction
The energy team's first step was to check internally. The ESCO responsible for the school's thermal systems reviewed their scope: no new equipment had been commissioned, no reconfiguration had taken place, no fault condition was active. Their Building Management System showed normal operation on every circuit they managed.
The school administration was equally unable to explain the change. No new systems had been installed inside the building. The recent relamping project had been completed months earlier. The window upgrade programme had recently been completed..
Both parties, each operating within their own defined scope, had no explanation. But the meter data was unambiguous — and had been for weeks. With no remote explanation available, the team decided to go on site.
Field Verification
The site visit took place approximately ten weeks after the anomaly first appeared. Technicians from the energy management team and the ESCO attended together.
Inside the school, inspection confirmed that the building's own electrical systems were operating as reported. Nothing inside the building accounted for the 11 kW step change.
Then the team looked beyond the school's perimeter.
Adjacent to the school grounds, a new annex building was under construction — its inauguration scheduled for the following months. Beside it, enclosed behind a temporary security fence, sat an heat pump: 13.4 kW rated capacity, control panel showing normal operating mode, running continuously. The unit was providing climate conditioning to the construction site and the new building during its finishing phase.
It was not registered under the ESCO's maintenance contract. It had never been added to the school's energy register. It had not been included in any monitoring scope. It was, however, connected to the school's existing meter point — drawing power through the same POD that Ento had been reading every hour since 2021 (the first connection happened in 2025, but the previous data history was automatically retrieved).
Impact
When the anomaly was first identified, the platform automatically quantified the excess load against the school's historical baseline and produced an upfront estimate of the annual cost — before any site visit had taken place, and without any manual calculation by the energy team
The heat pump was shut down on 28 March 2026. From that date, the platform began comparing actual consumption against an adjusted baseline model built from the building's own pre-anomaly data, corrected for outdoor temperature and occupancy calendar. After ten days of post-intervention metering, the first verified figures are already in: a 17% reduction in consumption against the adjusted baseline, with the annualised saving tracking close to the original estimate.
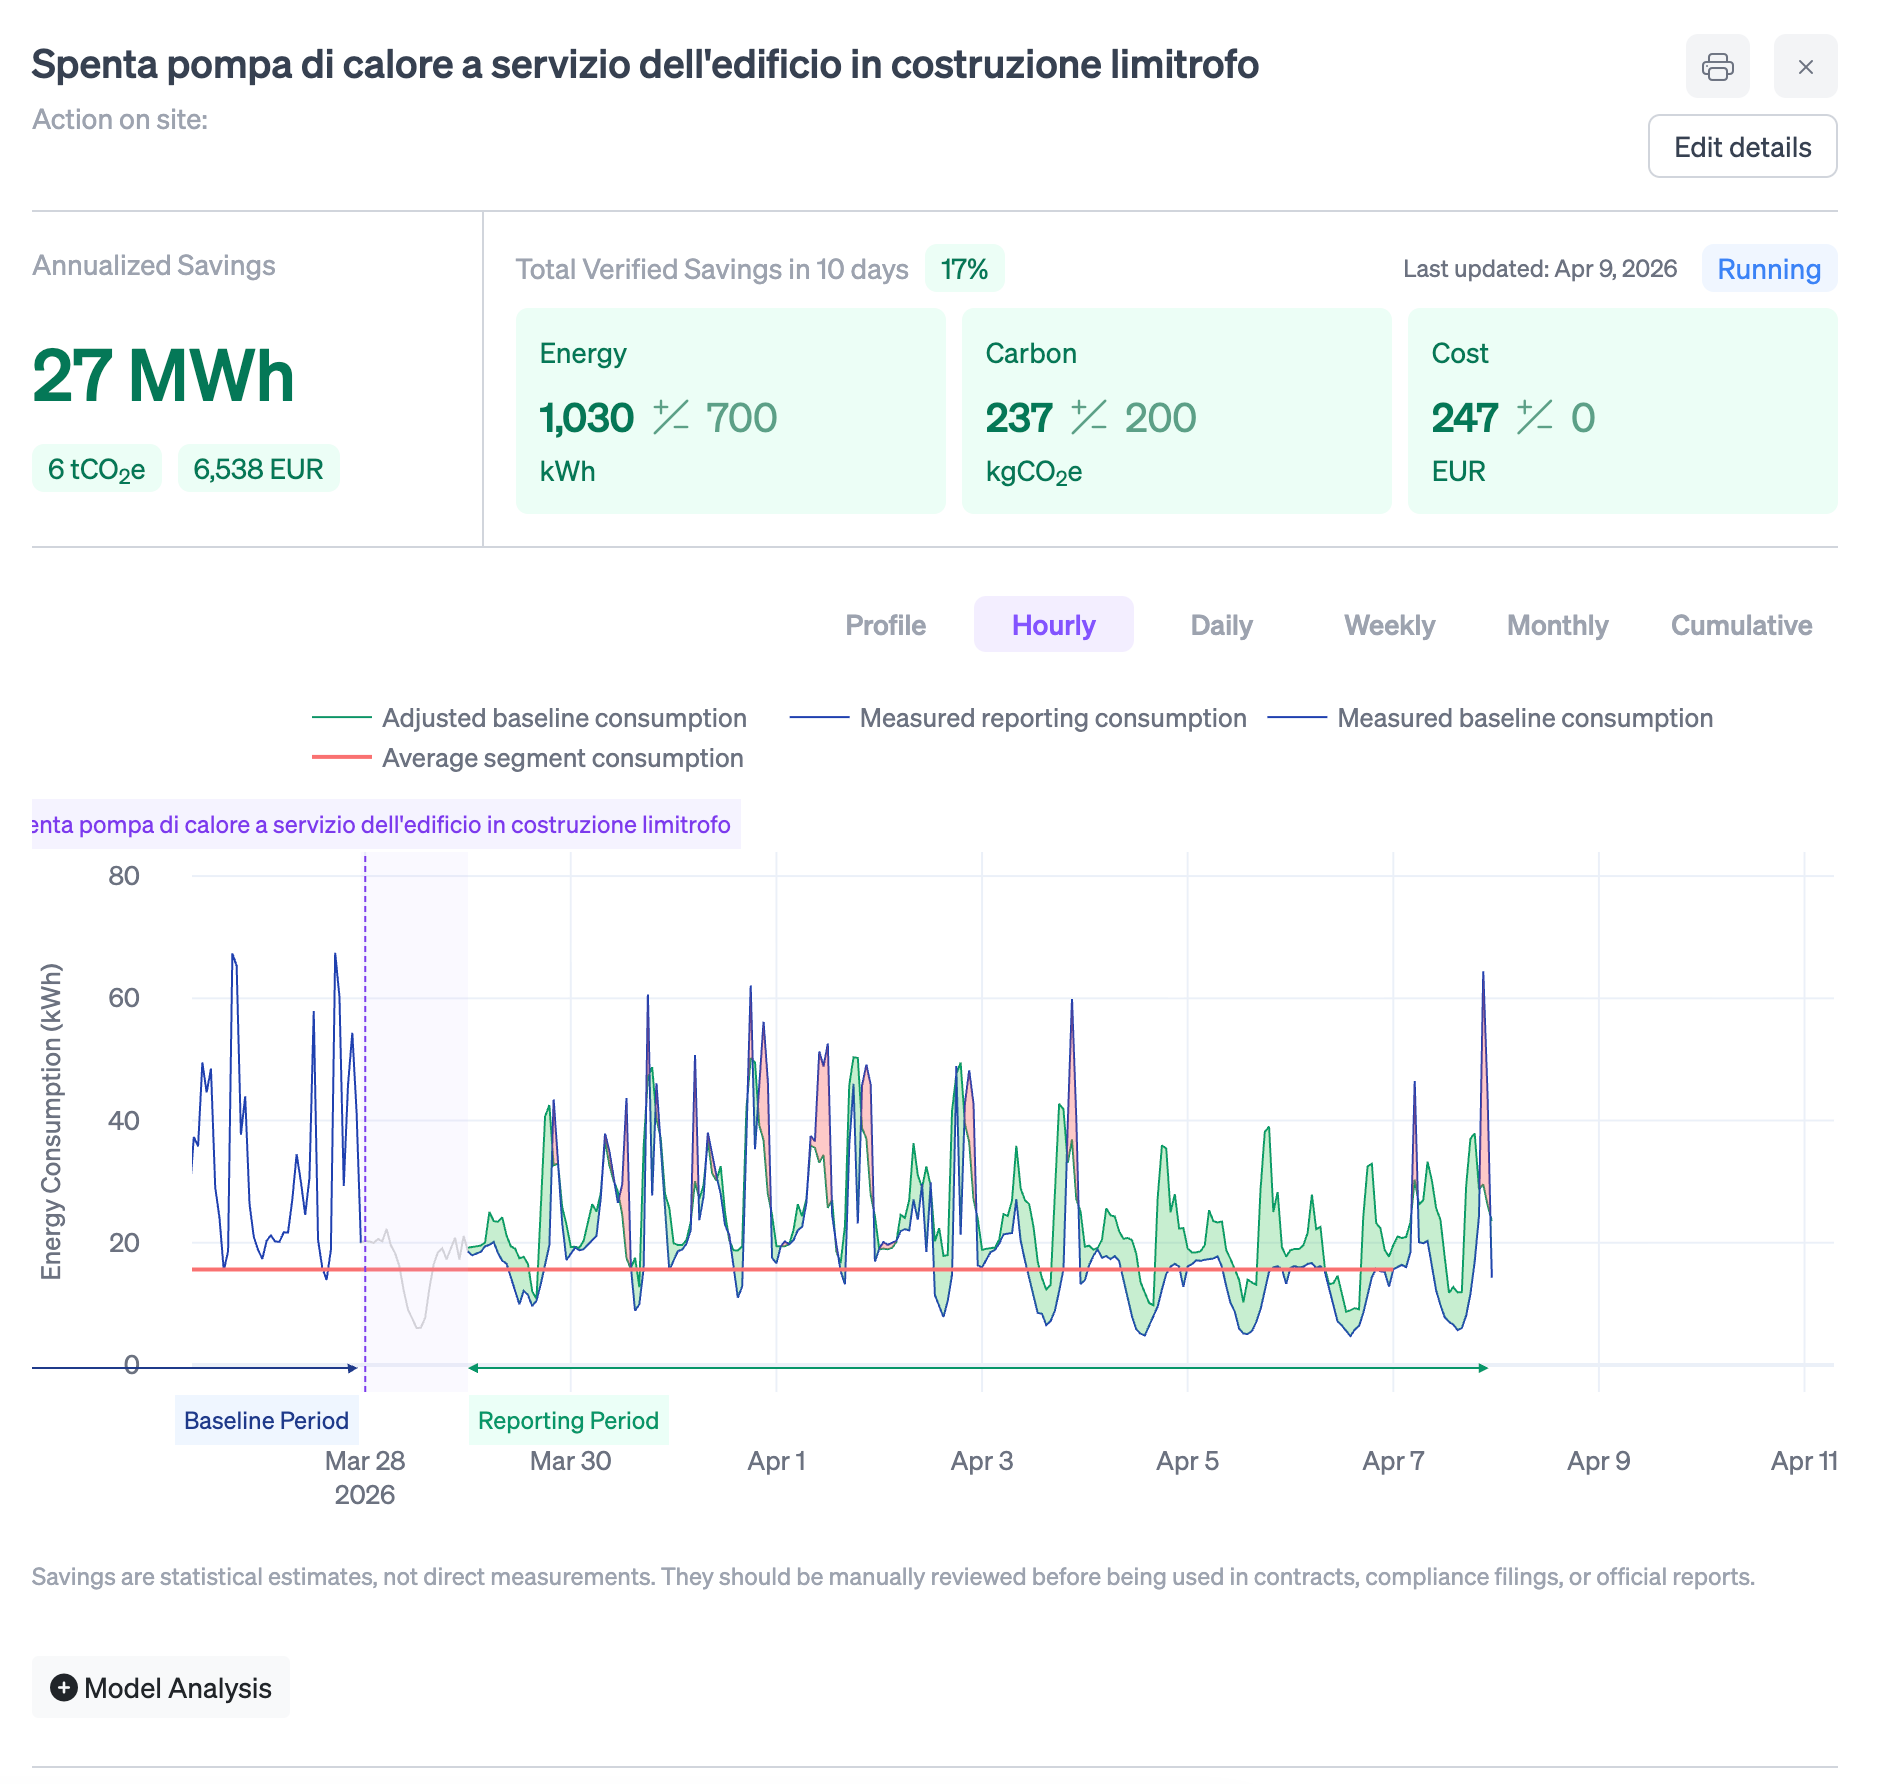
Project Impact: Estimated vs. Verified
- Energy Saving: 32 MWh/year (Estimated) ➔ 27 MWh/year (Verified)
- Cost Avoided: €7,740/year (Estimated) ➔ €6,538/year (Verified)
- CO₂ Avoided: 7 tCO₂e/year (Estimated) ➔ 6 tCO₂e/year (Verified)
- Hardware Needed: None ➔ None
The two figures are not in conflict — the estimate at detection used the raw excess load magnitude, while the verified figure reflects the adjusted baseline model. Both are calculated automatically by the platform: the first to quantify the problem at the moment of detection, the second to measure the saving once the intervention is made. No spreadsheet, no manual data pull, no waiting for the next billing cycle.
Closing Insight
The heat pump was not broken. It was not the result of anyone acting in bad faith. The ESCO was managing exactly what its contract covered. The school administration had made no changes to the building. Every party, within their own defined scope, had reason to believe everything was in order.
What made the waste visible was not new technology. It was reading the same meter that had been in place for years — but reading it at hourly resolution, against the building's own five-year history, with no manual effort required to surface the deviation.
The broader pattern this case illustrates is common wherever school portfolios intersect with construction activity: new buildings routinely draw temporary power from adjacent existing meter points, often with full authorisation for the construction phase and no formal follow-through on who bears the cost once the bills arrive. The energy team now has a concrete trigger to add "verify POD scope at construction start" to its standard protocol for any site with adjacent building works. That protocol costs nothing to implement.
The alternative, as this case shows, runs to over €7,700 per year before anyone notices — and the cost of not noticing is rising. The Italian wholesale electricity price (PUN) reached €154/MWh in April 2026, up 39% from €111/MWh in October 2025. The 32,245 kWh identified here were wasted during a period of sustained price pressure, not a calm market. Early detection is not just an operational discipline. At current prices, it is a material budget decision.
PUN data source: Gestore dei Mercati Energetici (GME), October 2025 – April 2026.